
Cutting the police funding cake(s): now is the best opportunity to reform the funding formula but wider concerns about fairness and service delivery won’t go away
The change of government arguably offers the best opportunity in years for a revised police funding formula to be implemented. But that won’t address wide inequalities in funding and especially the balance between government and council tax precept revenues, nor whether overall resources are sufficient. This blog sets out the detail and raises a number of questions.
Anyone who has ever hosted a children’s birthday party will be familiar with the challenge of cutting the cake in a way that doesn’t result in endless rows about who has ended up with the biggest piece, who got the most smarties, and how unfair it all is.
In the world of police funding, the Home Office hosts the biggest party and cuts the main funding cake, and every December each of the 43 police forces in England and Wales is given their slice. While the size of the cake varies according to the size of the overall funding pot, the relative size of each slice is based on a ‘funding formula’ that, like a pack of sponge cake mix languishing at the back of a kitchen cupboard, was out of date in at least 2015 and no longer rises as intended.
Unlike the children’s party, however, each force also receives a second cake from local council tax payers, who in some parts of the country have deeper pockets than in others. The result is that some forces’ plates end up piled higher than others. Over the years, the absolute and relative sizes of each force’s Home Office slice and council tax cake have changed to differing degrees in different forces, as has the number of local residents in each force area. The complaints of unfairness have grown in volume, mainly from those forces with the smallest portions per resident, who have most to gain from any change. The arrival of a new government with a huge majority and a 5-year term ahead might be the best opportunity in years to start addressing the unfairness.
A very brief overview of police funding
As a public service, police funding in England and Wales is relatively unusual in that it very transparently consists of national and local elements, in the form of central government grants and council tax precepts, with the latter appearing as a separate line on council tax bills. The main government grant is distributed on the basis of a Police Allocation Formula (‘funding formula’) that determines how large a slice of the overall grant funding cake each police force receives. Given that the current formula was introduced in 2006 it is now hopelessly out of date, notably relying in parts on data from the 2001 Census. As long ago as 2015 a revised model was set to be introduced (I wrote about it here) until errors were spotted and the whole effort imploded. A different revised model is currently sat on a shelf in the Home Office, waiting for the government to decide that the necessity of introducing it outweighs the political risks of the upheaval it will inevitably cause. The Lincolnshire PCC Marc Jones has threatened to seek a judicial review of the failure of the government to introduce the new model (his action started under the previous Conservative government).
Alongside this main grant sit a number of other government grants, including to fund Counter Terrorism (CT) policing, and a National and International Capital Cities (NICC) grant that mainly goes to the Met and recognises the unique challenges of policing the capital.
Uneven funding cuts and population growth
In common with virtually all public services, policing was badly affected by the austerity years that followed the 2010 general election. Those cuts did not fall evenly, however, as they only affected the main government grant – as a roughly 30 per cent flat rate cut – and took no account of wide variations in the proportion of force-level funding that was derived from precept revenues. As a result, between 2010/11 and 2018/19 overall police funding fell 19 per cent nationally, but that varied from only 11 per cent in Surrey to 25 per cent in Northumbria.
Subsequent changes to precept rules progressively increased the amount by which PCCs and their mayoral equivalents could raise the policing precept in their area, resulting in the precept becoming increasingly important to the overall funding mix. Then the Police Uplift Programme came along and allocated funding for an extra 20,000 police officers on the basis of the funding formula, ignoring the pattern of earlier cuts and further complicating the picture, and to a degree further entrenching inequality.
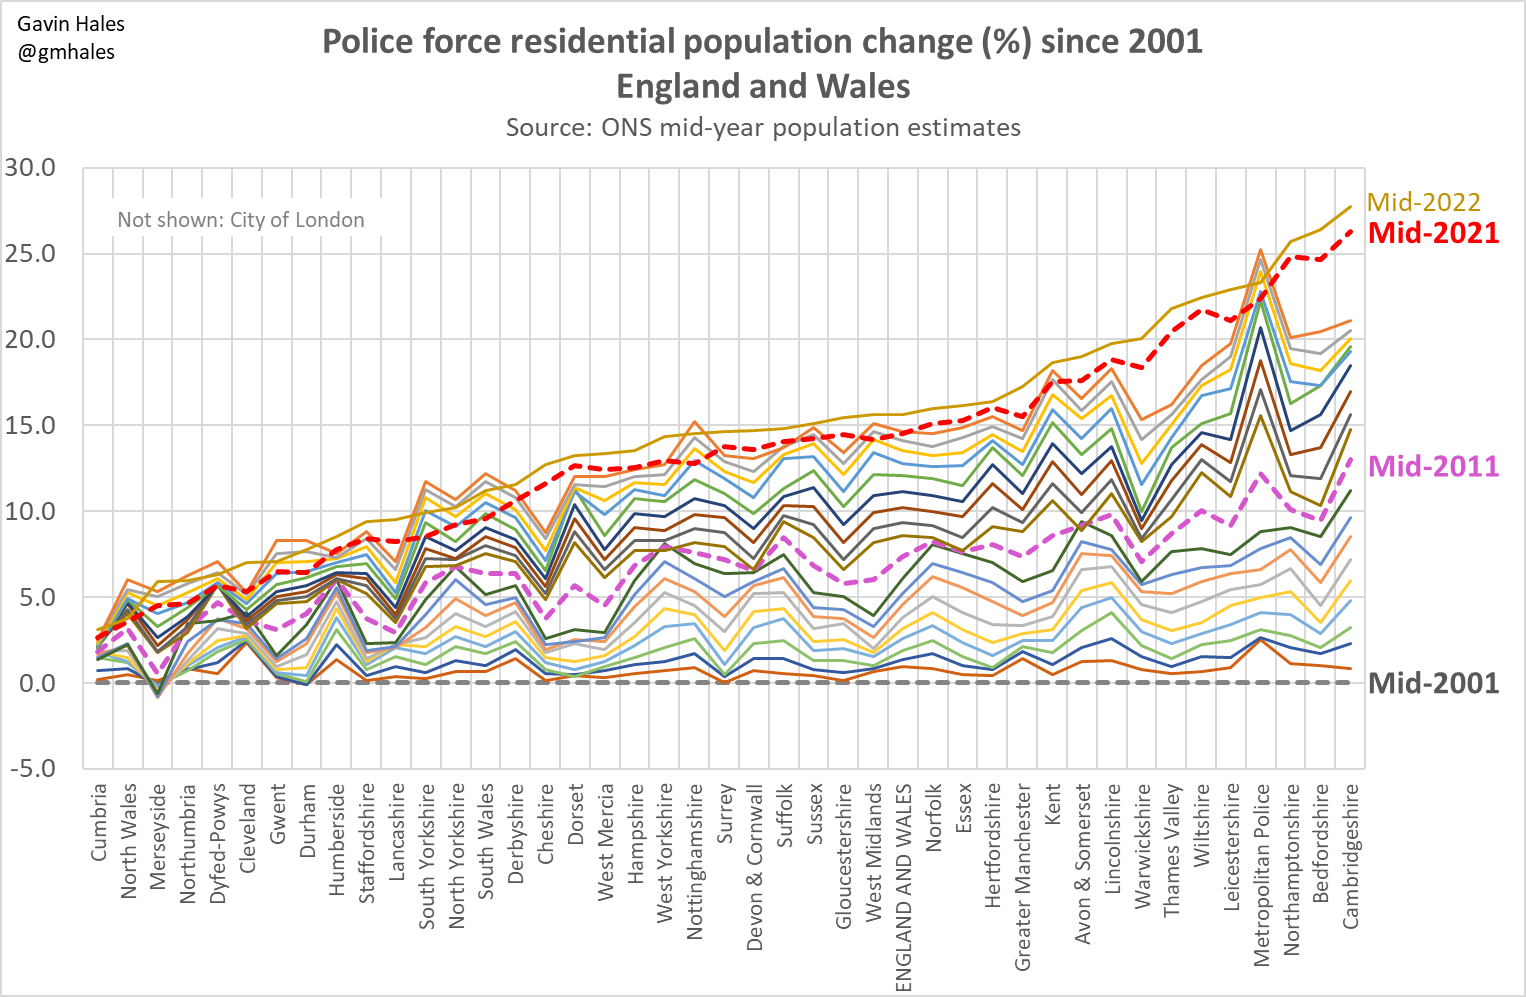
Meanwhile, the rate of population growth between 2001 and 2022 has varied greatly across the country, with the residential populations of Northamptonshire, Bedfordshire and Cambridgeshire rising more than 25 per cent, but those of Cumbria, North Wales and Merseyside less than 6 per cent.
[Click on image to view graph]
Funding trends per capita
The publication last summer by the Home Office of a funding report setting out government grant and council tax precept revenues (in both nominal and real terms, data tables here) for all forces for the period from April 2015 to March 2024, provides an opportunity to examine trends over that period and see where things ended up by 2023/24 (as at July 2023). In total, the funding included in the report covers core funding, council tax grants, NICC grants, pensions grants, Police Uplift Programme grants, the police capital grant and council tax precepts. Earlier years are an important exclusion, but explained in the Home Office report as being “because the changes to the structure of policing and policing funding… mean that definitions of… funding streams would not be consistent prior to the financial year ending 31 March 2016”. Which is unfortunate.
In my analysis of the funding data, I have incorporated ONS mid-year police force population estimates to examine per capita funding (limited to residents and not taking account of transient populations such as commuters and visitors). At the time of conducting the analysis, these extended to mid-2022, which I have used for both 2022/23 and 2023/24. Note that City of London Police is excluded from the analysis because the tiny residential population makes it an extreme outlier on a per capita basis.
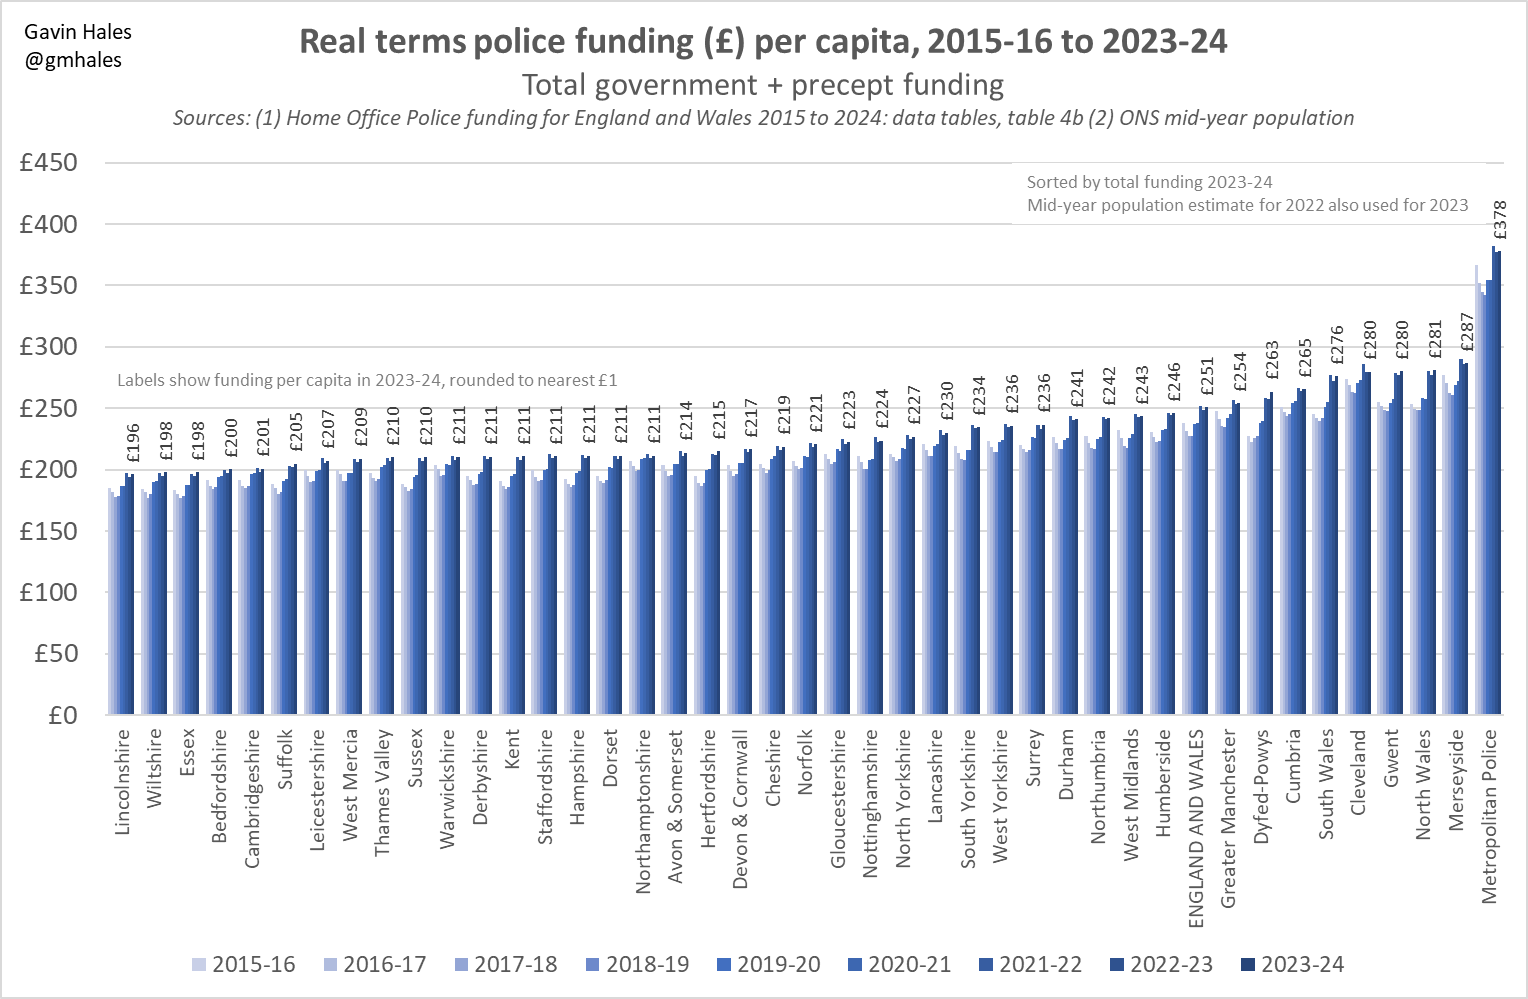
This first chart shows total real terms police funding per capita, for each force and for each year from 2015/16 to 2023/24. All forces’ funding shows a characteristic J-shape pattern as funding fell and then rose, although the rises were not even, including because of the surge associated with the Police Uplift Programme. Total real terms funding per capita in 2023/24 ranged from £196 in Lincolnshire to £287 in Merseyside and £378 in the Met, although the latter includes NICC funding (and these figures are not adjusted for the higher costs of policing places like London – reflected in the Area Cost Adjustment factors in the funding formula).
[Click on image to view graph]
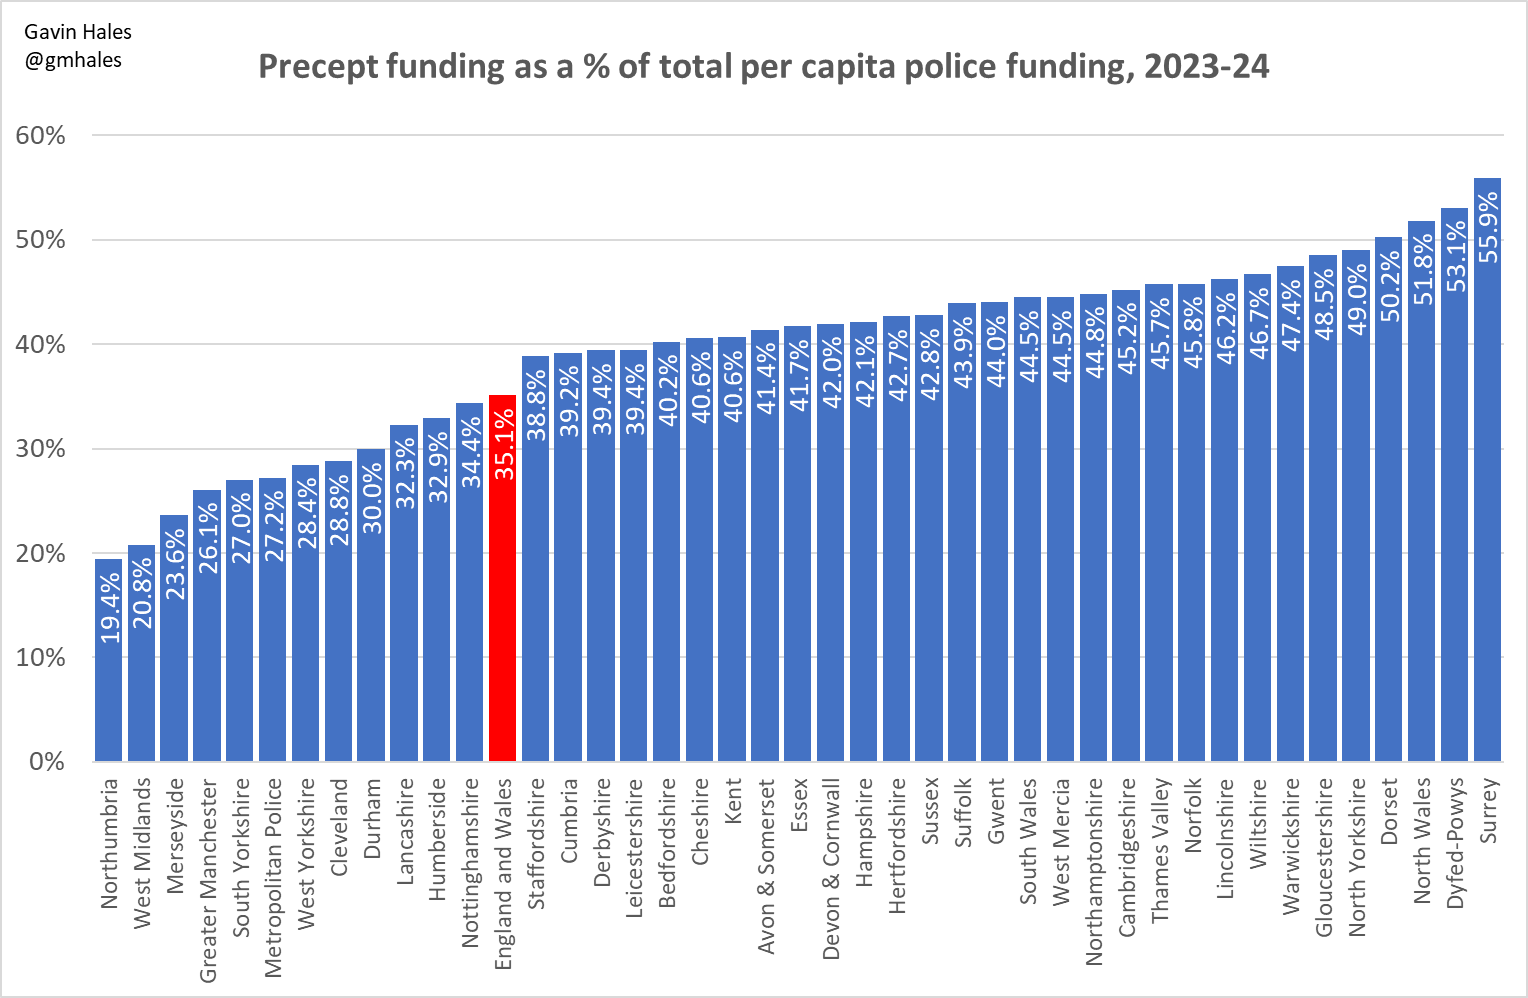
The next chart illustrates the way the funding mix varies between forces, with only 19.4 per cent of Northumbria’s funding in 2023/24 being derived from the precept, compared to 55.9 per cent in Surrey (where for many years before austerity the precept was increased as much as possible, expressly to fund neighbourhood policing). In general, the more urban forces sit towards the lower (left) end of the distribution, which has a distinct ‘tail’.
[Click on image to view graph]
When we examine how funding per capita has changed over time relative to 2015-16, it is clear that there has been a pronounced shift towards the precept, which for England and Wales as a whole rose 31.5 per cent to 2023/24 while the government grant ended up 4.7 per cent below its 2015/16 starting point (each line represents one force and each force has a precept line and a government funding line). Over the period, precept funding has risen from 28.2 per cent to 35.1 per cent of total funding.
[Click on image to view graph]
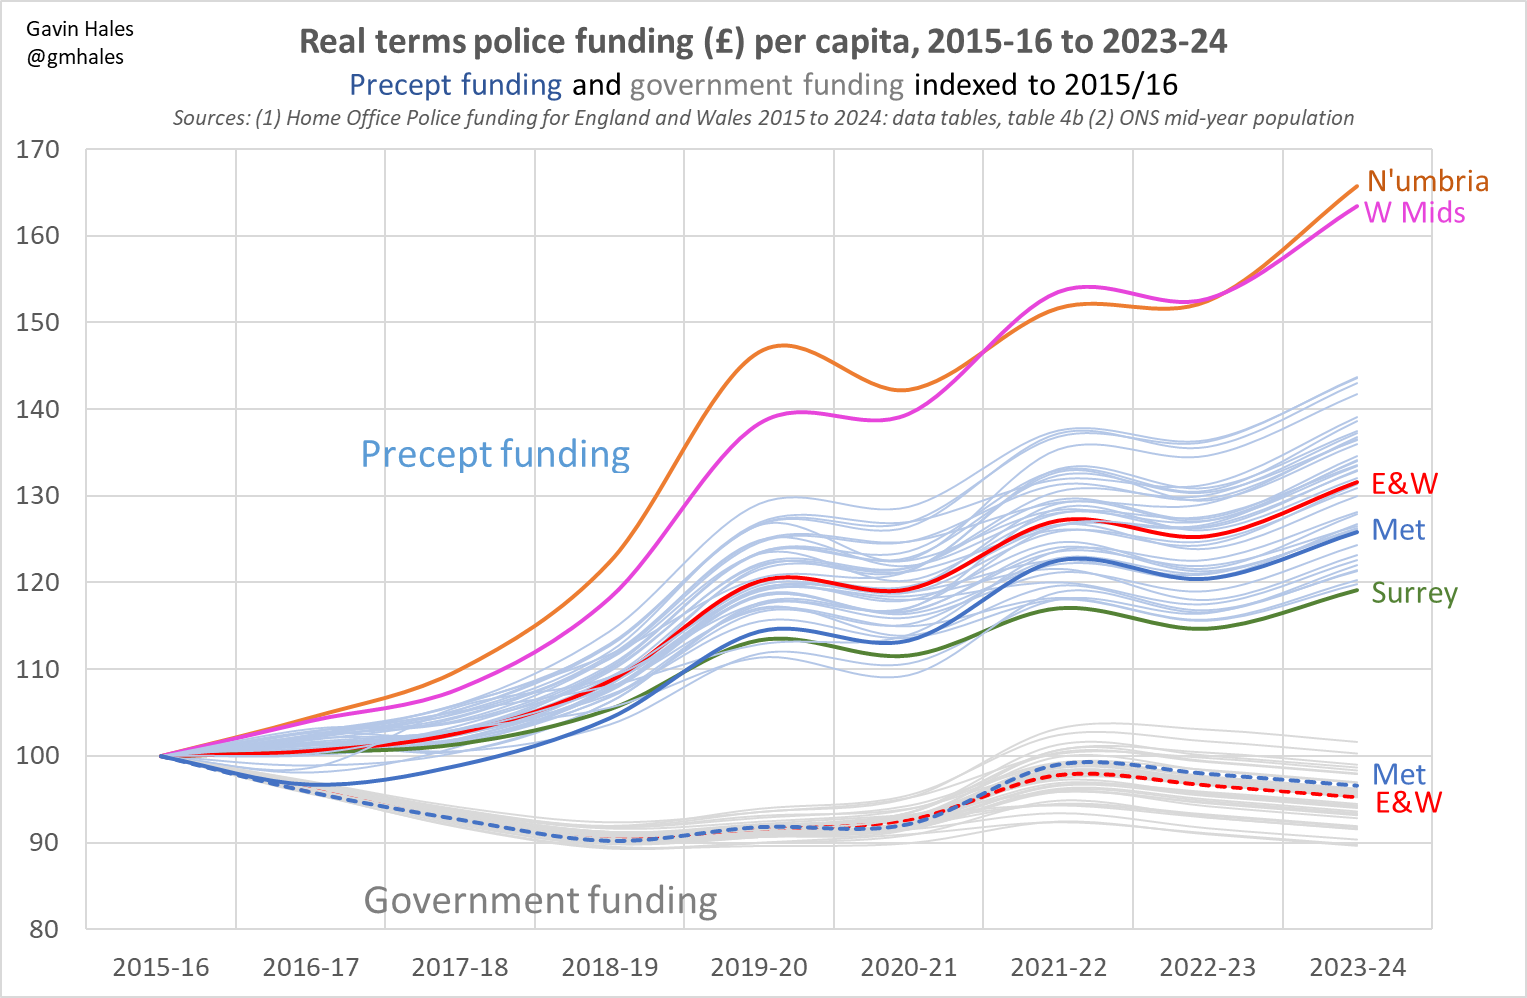
Reflecting their relatively very weak starting positions, and shifting government policy regarding the cap for increasing the precept without a local referendum (variously as a percentage and then a cash maximum, the latter making a larger percentage difference to lower precepting forces), the largest relative increases in precept are seen in Northumbria and the West Midlands, although as we’ve just seen above those are the two forces where the precept continues to make the smallest proportional contribution to their overall funding. In a way, they have been running to stand still.
The next chart illustrates the degree to which per capita police funding in 2023/24 is a mixed economy, showing for each force their government (horizontal x-axis) and precept (vertical y-axis) funding, and the sum of those two in their position relative to the pink ‘total funding’ diagonal lines. For England and Wales as a whole (the red dot), £163 per capita government funding combined with £88 per capita precept funding result in £251 total. (NB the Met is off the chart to the right, but I’ve done that so the detail of the other forces can be seen.)
[Click on image to view graph]
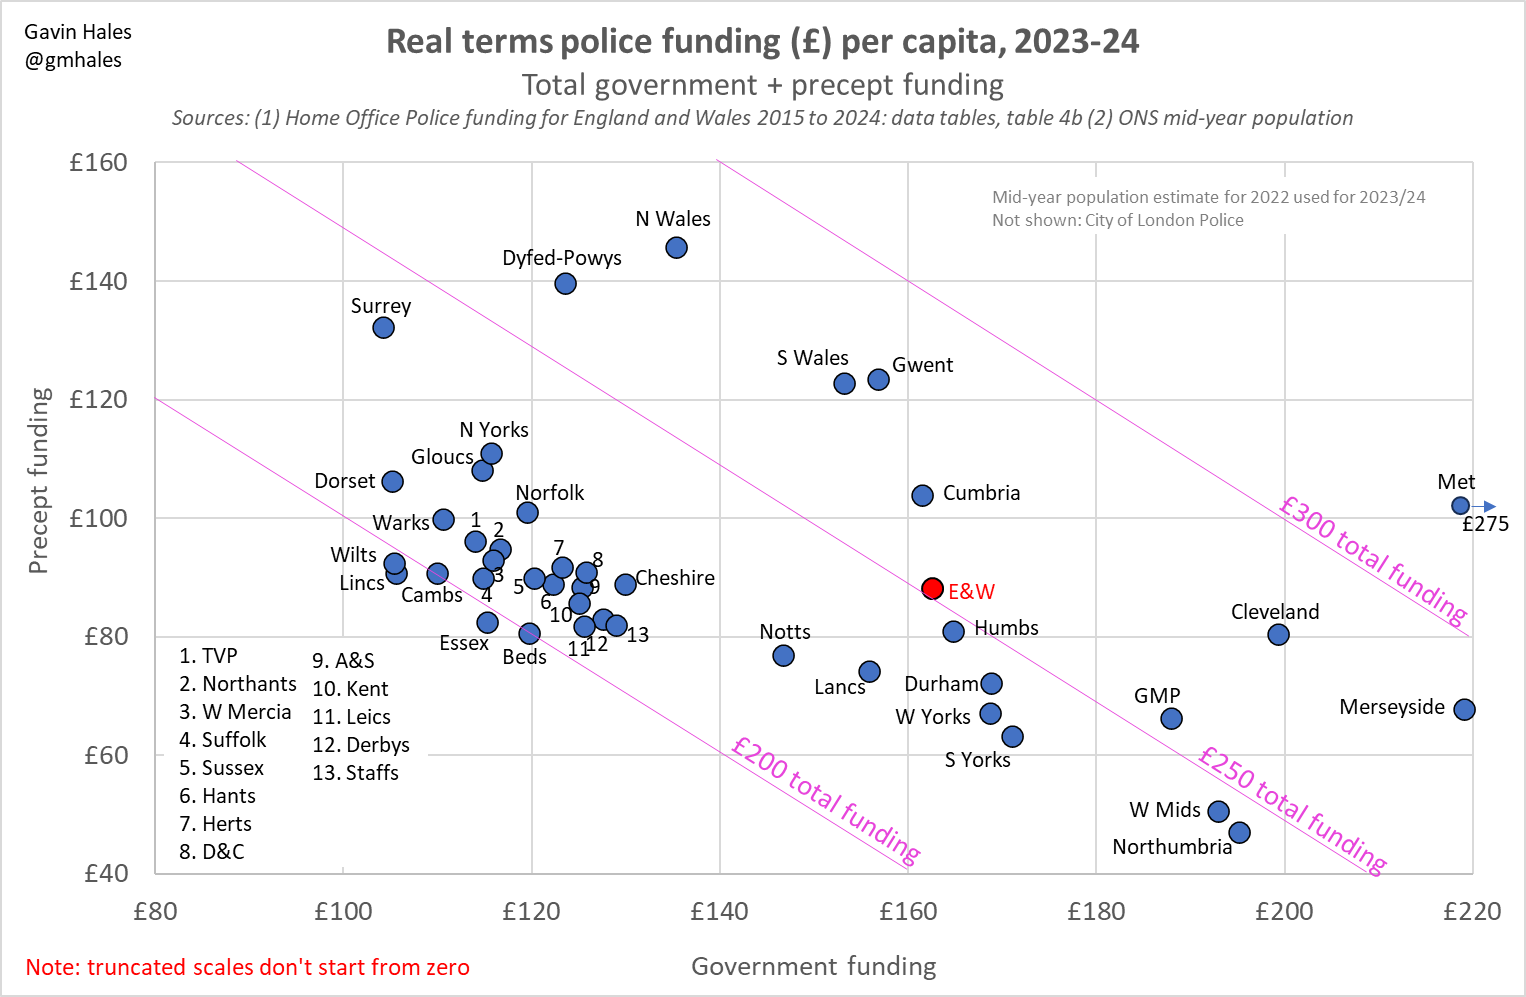
It is instructive to compare Surrey and Northumbria, and Merseyside and North Wales, as pairs of forces that have broadly similar total funding (their position relative to the pink diagonals) but reached in very different ways. For example, Surrey receives £104 of government grant and £132 of precept for a total of £237 per capita (after rounding) while for Northumbria the equivalent figures are £195 and £47 for a total of £242. The Welsh forces are conspicuously well funded from the precept, and overall.
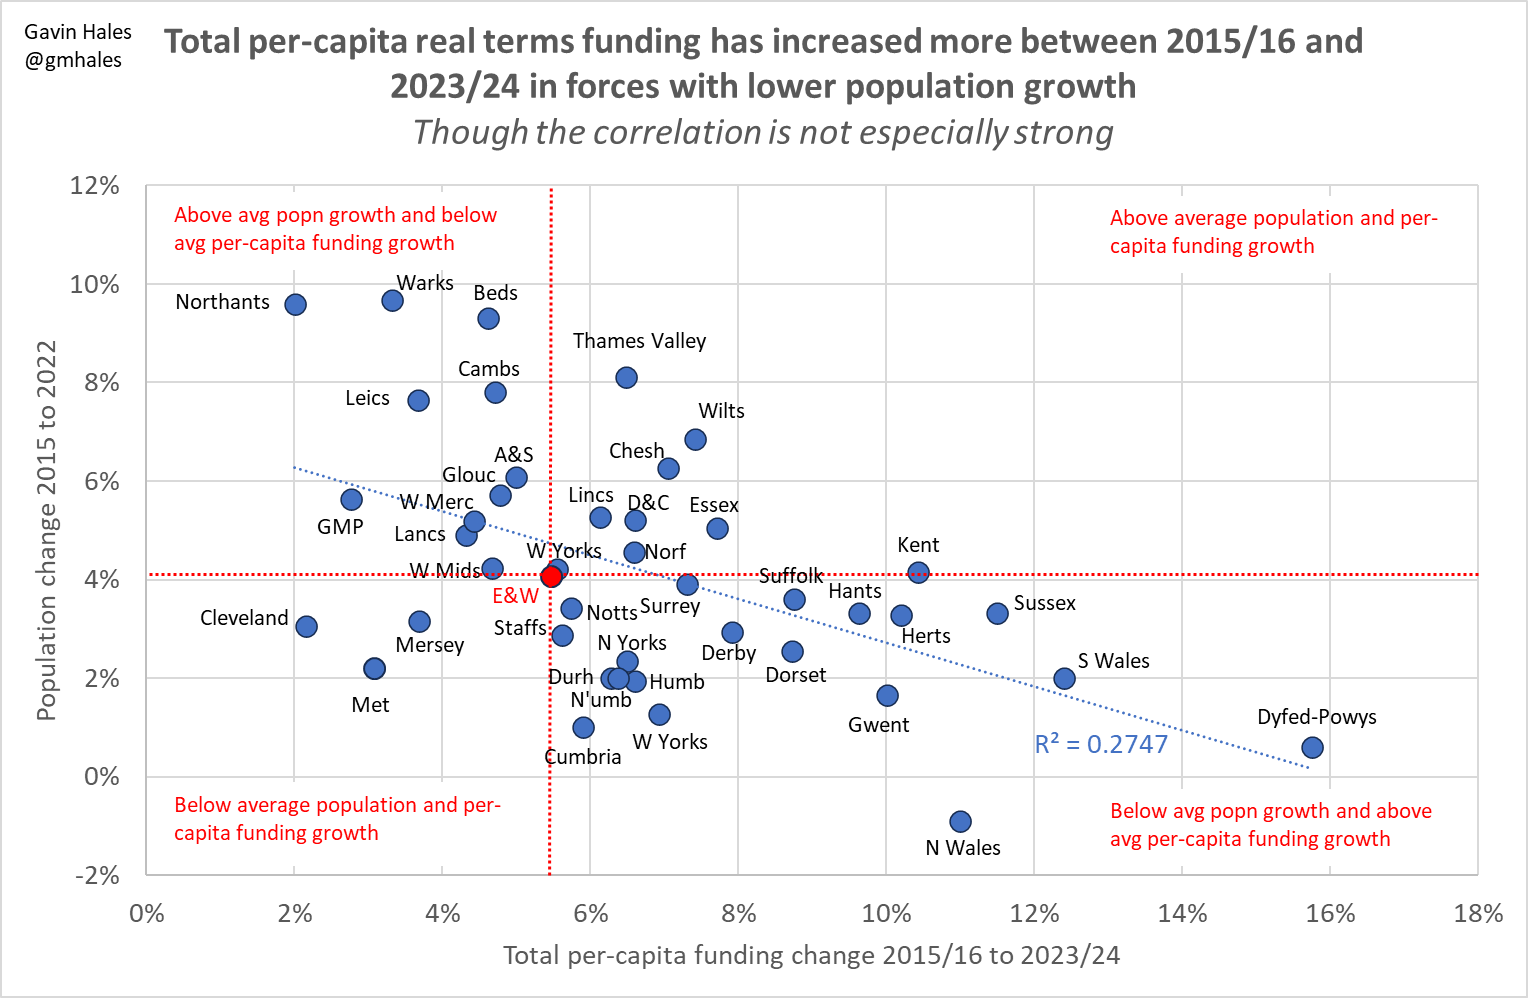
Finally, we can examine the relationship between changes in force populations and total per capita funding, here between 2015/16 and 2023/24, with the chart divided into above and below-average quadrants. Although the relationship is rather weak (a function of including precept funding – see below), to the extent that there is a relationship forces with lower population growth have seen larger increases in total per capita funding, which makes sense when you consider that the funding formula is so out of date (for example, it currently relies on the ‘projected population in 2013’). The forces that have done worst relative to 2015/16 are in the top left, while those that have done best are in the bottom right (again, notably including the Welsh forces).
[Click on image to view graph]
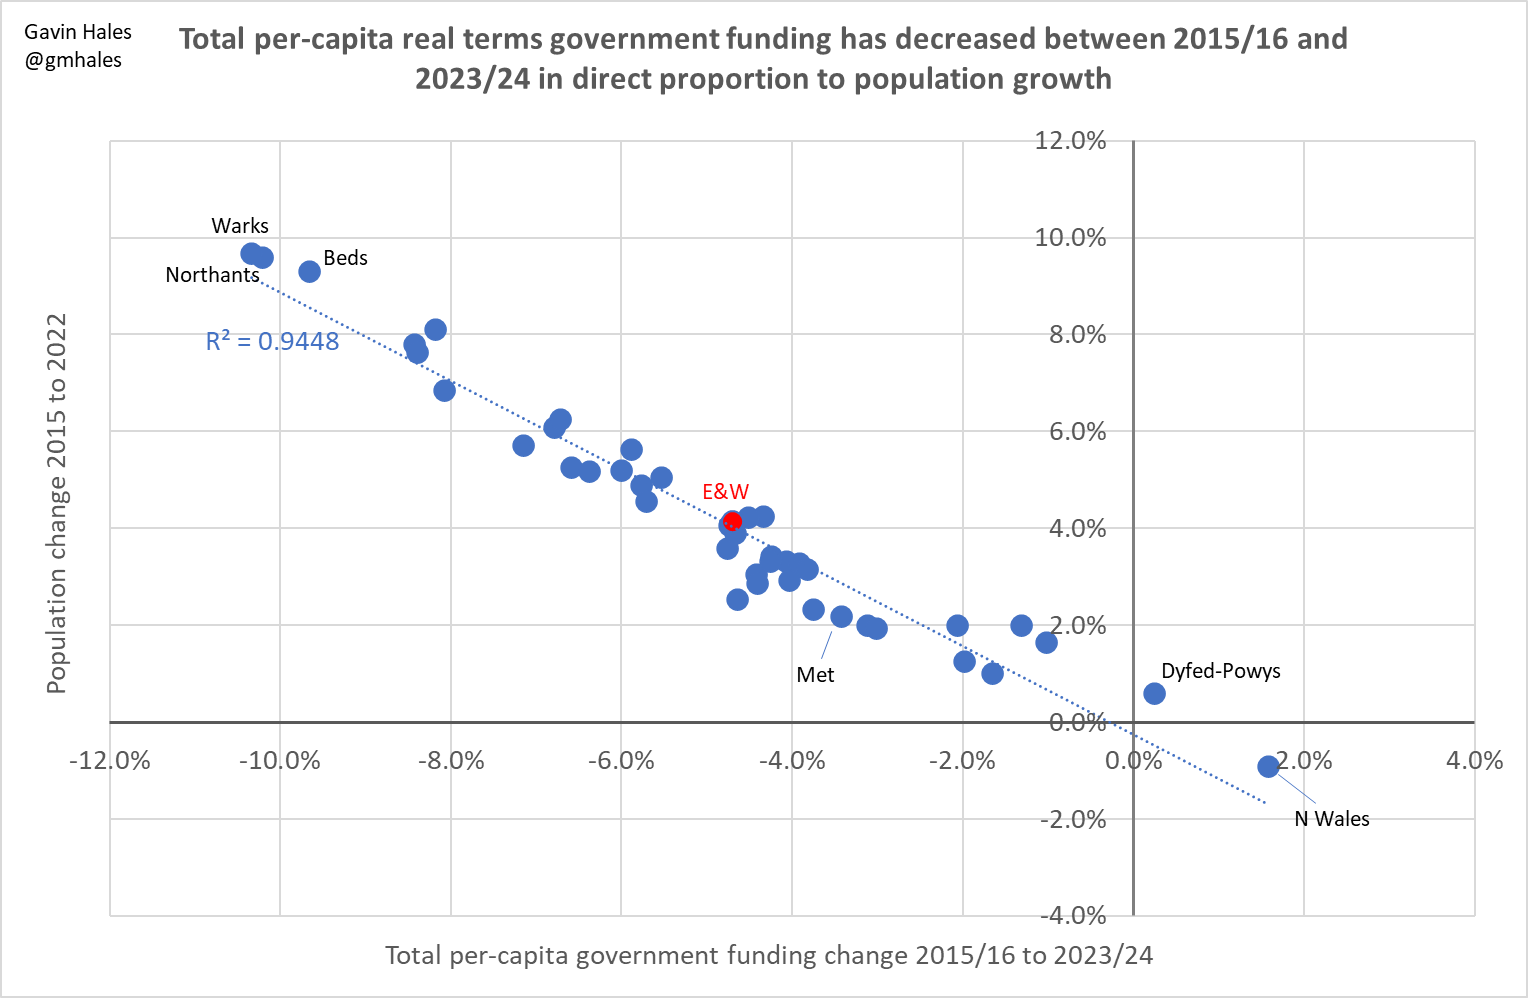
Repeating the same analysis but looking only at changes in per capita real terms government funding shows an almost perfect correlation, highlighting the impact of the funding formula relying on very out-of-date population figures. Here, the only ‘winners’ are Dyfed-Powys and North Wales, reflecting respectively their tiny increased and decreased population growth calculations between 2015 and 2022. At the other end, Warwickshire and Northamptonshire have seen their per capita government funding fall by more than 10 per cent.
[Click on image to view graph]
(Why) does all of this matter? Some discussion points
Fairness in police funding is necessarily a rather elusive concept, reflected to some extent in the complexity of the current funding formula with its ‘top ups’ for things like sparsity and traffic and Area Cost Adjustment factors (which will also be out-of-date, and only apply when costs are above average). We don’t really know very much about things like productivity or value for money, in part because the police remit is extremely broad, varies in its composition from one part of the country to another, is to a varying degree reactive vs proactive, and is highly elastic: priorities change, operating models aren’t standardised, and effort can be spread more or less thinly. Likewise, the degree of adherence to crime recording rules varies between forces, complicating any assessment of crime demand (especially in the absence of a much larger Crime Survey for England and Wales sample, able to produce more detailed force-level estimates). Nevertheless, the picture set out above looks quite a lot like a postcode lottery, which for a universal (and essentially monopolistic) public service can only ever be problematic.
As best illustrated by the cases of Surrey and Northumbria, the implementation of austerity, as it related to police funding, paid no heed to the different force-level funding mixes, with the result that the pain was much more acute in some parts of the country than others. Since the per capita funding nadir in 2017/18, however, the picture has continued to fragment as a function of the combination of differential population growth rates and precept rises, and the Uplift allocations (and success or otherwise in realising them). That looks like an increasingly unsustainable and untenable situation.
Returning to our cake analogy, part of the solution must lie in introducing a revised funding formula so that the relative size of the government funding slices reflect today’s realities rather than those in the fossil record of demographic and other data. There will, inevitably, be winners and losers in that process, with big questions for government – and perhaps especially HM Treasury – about transitional arrangements to avoid damaging shocks. Acknowledging the political difficulties, there is unlikely to be a better time for the government to press go than now, with a full five-year term with a large majority stretched out in front of them to absorb and work through the pain. (The fact the government grant has become somewhat less important as a component of total funding over time will also paradoxically mean the impact of funding formula changes would be slightly less acute now than they would have been in the past.)
So, if not now, then when?
But that won’t solve the other key fairness problem, which concerns the growing importance of the other cake on our police funding plate, the council tax precept – and the way that is both built on a highly unequal tax base and is regressive in nature (in relation to property values). Disparities in precept are also perhaps the largest impediment to force mergers, if they ever make it back into consideration (the most recent proposed merger, between Dorset and Devon and Cornwall, foundered in 2018 due in large part to precept differences).
The final question concerns the total size of the funding ‘cakes’ added together, specifically whether they are sufficient to meet public needs and expectations for police services across the country. It is notable that Crime Survey for England and Wales measures of public confidence and victim satisfaction have been falling since 2016 or so, and that in spite of the Uplift, the public aren’t reporting increased police visibility. The police service will tell you that fulfilling their functions has become more complex and bureaucratic, and consequently slower – and therefore more expensive (for a given quality of service). Sir Mark Rowley is quoted as saying ‘it takes five times more work to get cases to court than it did 20 years ago’. The funding formula won’t address those issues, only being concerned with how to slice the government cake and not its size, whether alone or with the precept.